Retrax
Retrax is a standalone observability companion that can be attached to any application. Retrax lets user to:
- See every AI agent workflow run that your application executed
- Open a single run and trace it step by step — the execution graph, the time waterfall, and the call tree
- Inspect each step in detail: LLM calls, tool inputs/outputs, dependencies, tokens, and durations
- Debug failed runs, find slow steps, and audit exactly what the AI read and did
This quick guide will help you get started with the application.
Getting Started
Preconditions:
- You have a Google account that is on the list of accounts allowed to access the dev environment.
- You know the application URL:
https://dev.deconvolute.ai/Minion/retrax/#/
Steps:
- Open the application URL in your browser.
- If you do not have an active session, Retrax automatically redirects you to the Google sign-in page (
accounts.google.com). - Enter the credentials of your allowed Google account and confirm.
- After a successful sign-in you are returned to the application and the Workflow runs list opens.
Result: You are authenticated and see the list of workflow runs. The session is remembered, so refreshing the page does not ask you to sign in again.
Interface Overview
There are two main screens:
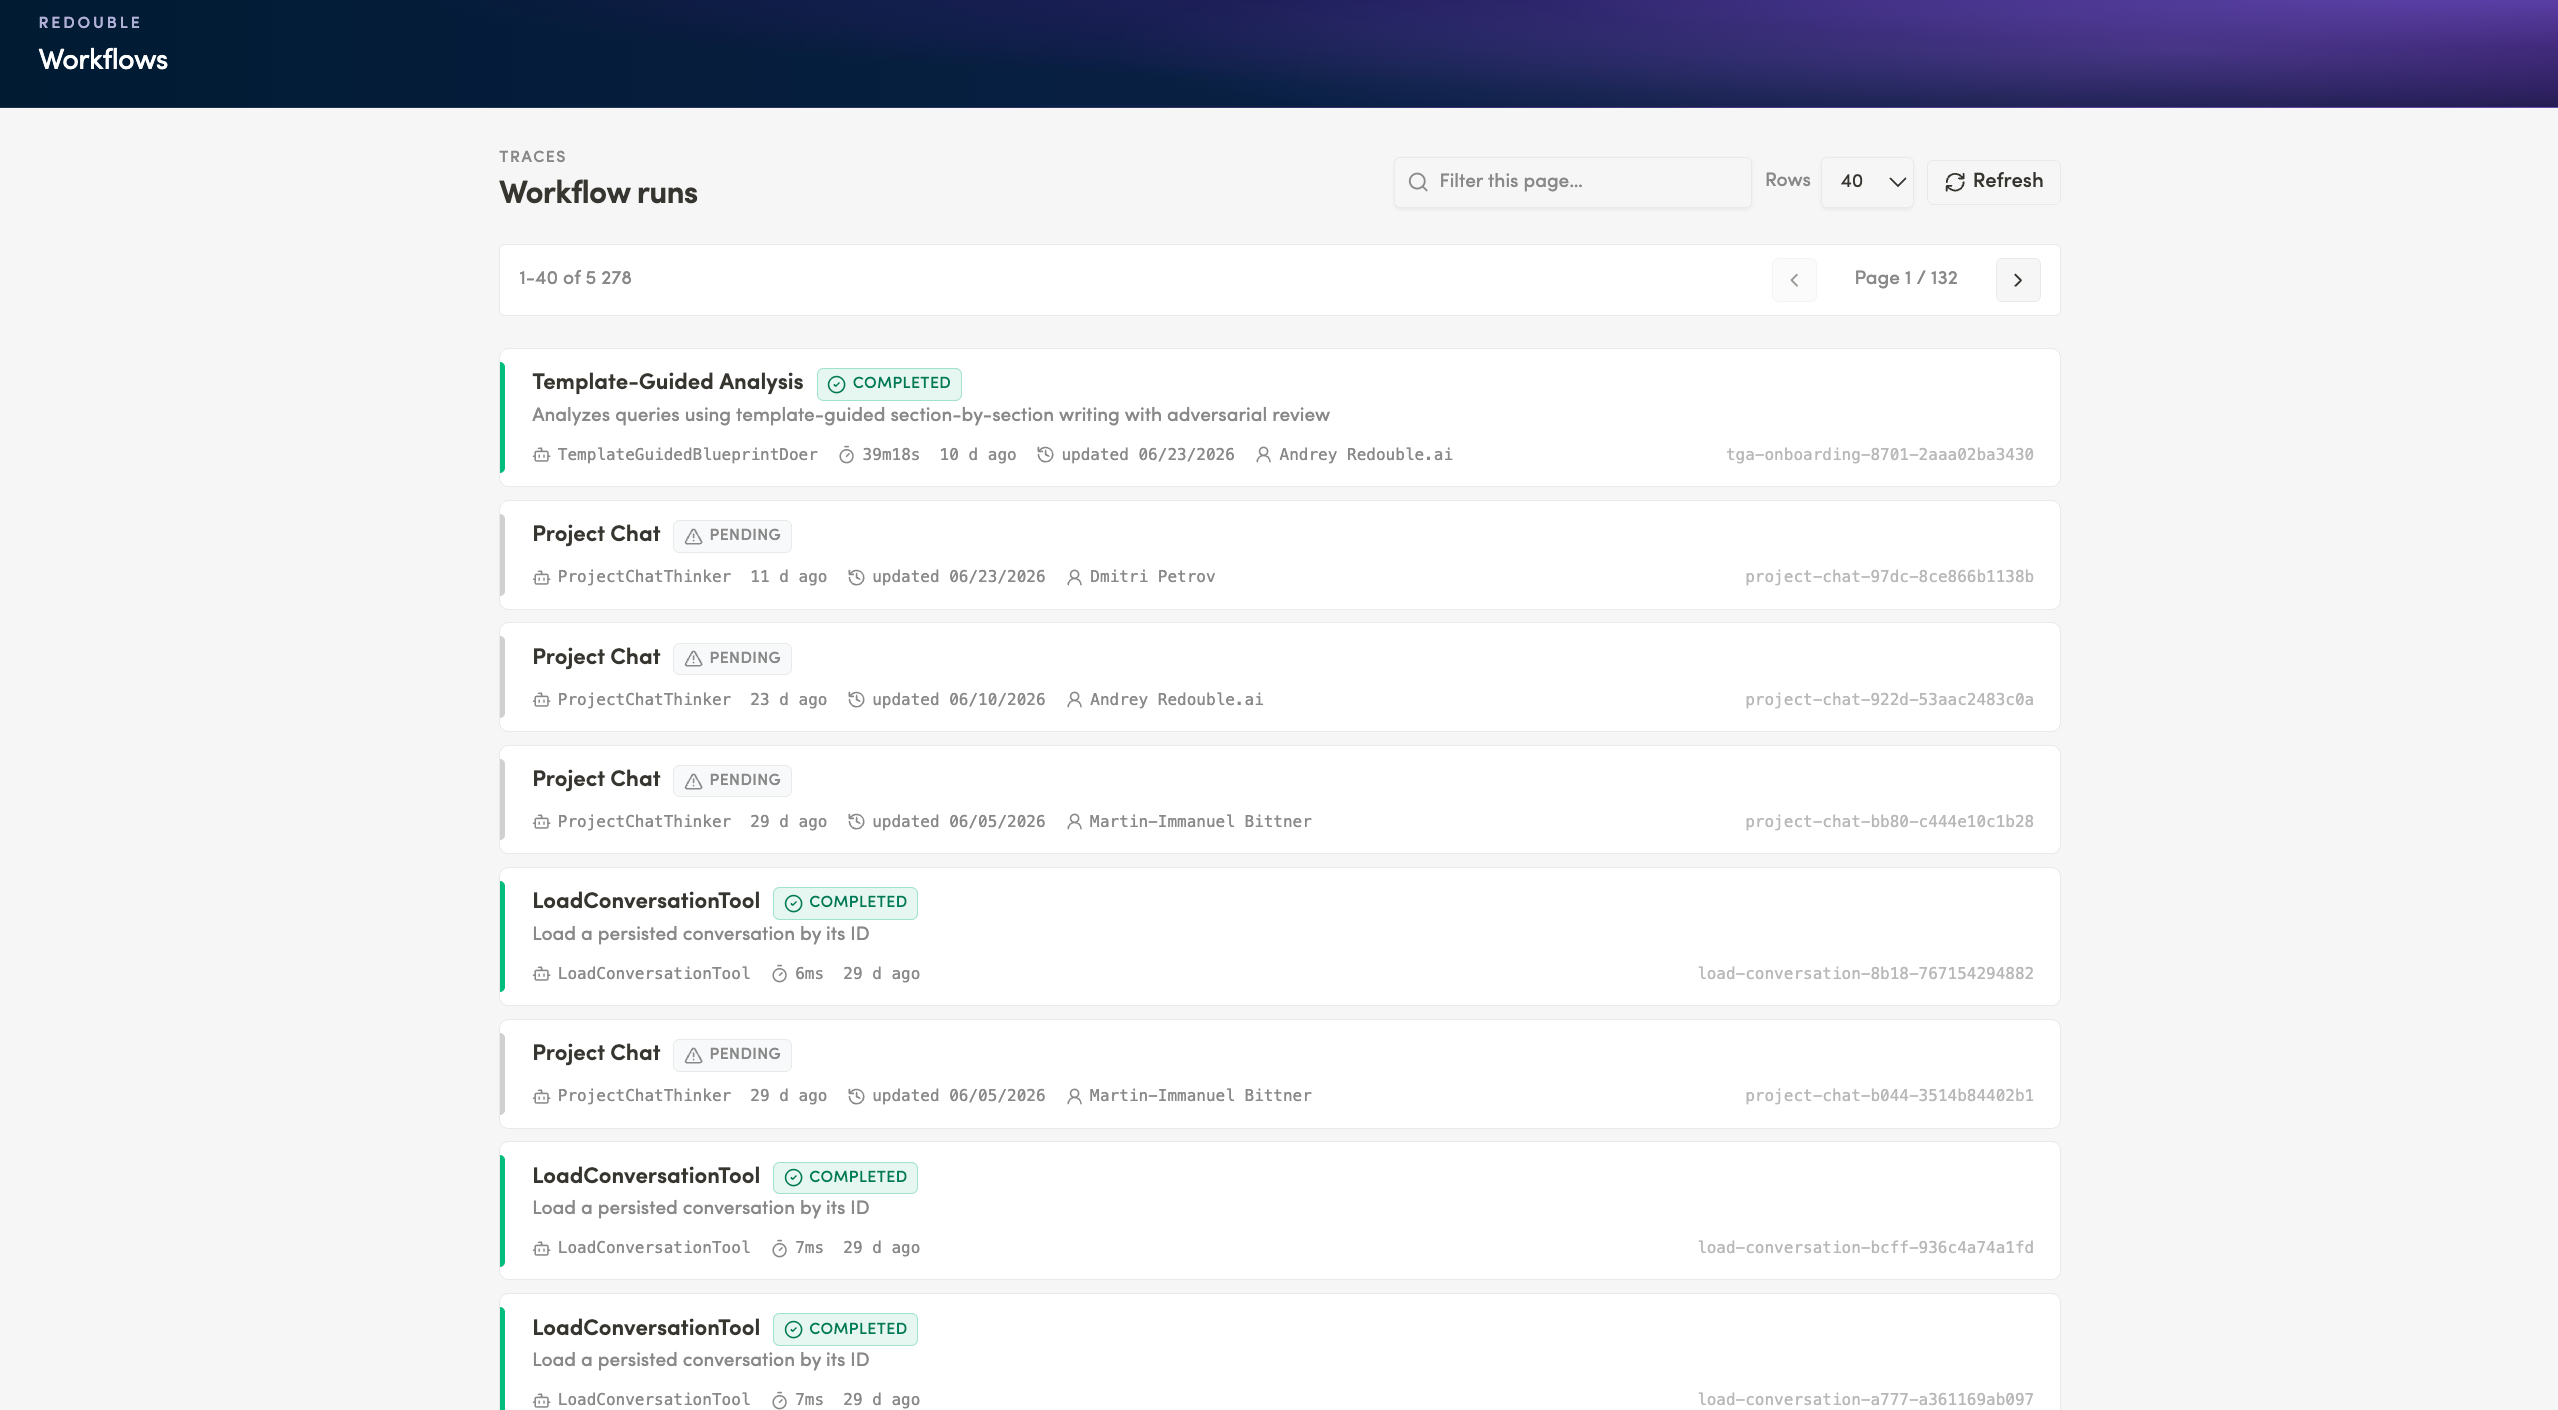
1. Workflow runs (Traces list)
The landing screen. It lists every workflow run and lets you search and page through them.
- Header: Workflows / Workflow runs (Traces)
- Filter field — "Filter this page…".
- Rows per page selector — 20 / 40 / 80 / 120.
- Refresh button and page navigation (Previous / Next).
- Run cards — each shows the process name, status badge, executor duration, relative time, update date, author/owner and a unique ID.
2. Trace detail
Opens when you click a run. It breaks one run down into nodes and steps.
- Top bar
- View switcher: Graph / Waterfall / Tree.
- Side panels group: Deps / Tool I/O / Details.
- Visualization area — the graph and waterfall.
- Right-hand panels — Inspector / LLM call / Trace tree.
Result: You understand where the run list lives, where a single trace is analysed, and which controls switch between views and panels.
Workflow runs
Preconditions:
- You are logged into Retrax and on the home screen
This page lists every workflow run and lets you search and page through them.
- Header:
- Filter field
- Rows per page selector — 20 / 40 / 80 / 120.
- Refresh button and page navigation
- Run cards — each shows the process name, status badge, executor , duration, relative time, update date, author/owner and a unique ID.
User can perform several actions:
Viewing the Runs List
What a run card shows:
- Process name The workflow that ran (e.g. Project Chat, Document Ingestion, Template-Guided Analysis).
- Status badge (Completed, Running, Pending or Failed, each with its own icon/colour.)
- Description Short text for some processes
- Executor The agent / job / tool that performed the run.
- Duration
- Time Relative and absolute.
- Author / owner Who created or owns the run.
- ID The unique run identifier.
Notes:
- Failed runs show the error text right on the card, so you can triage without opening the trace.
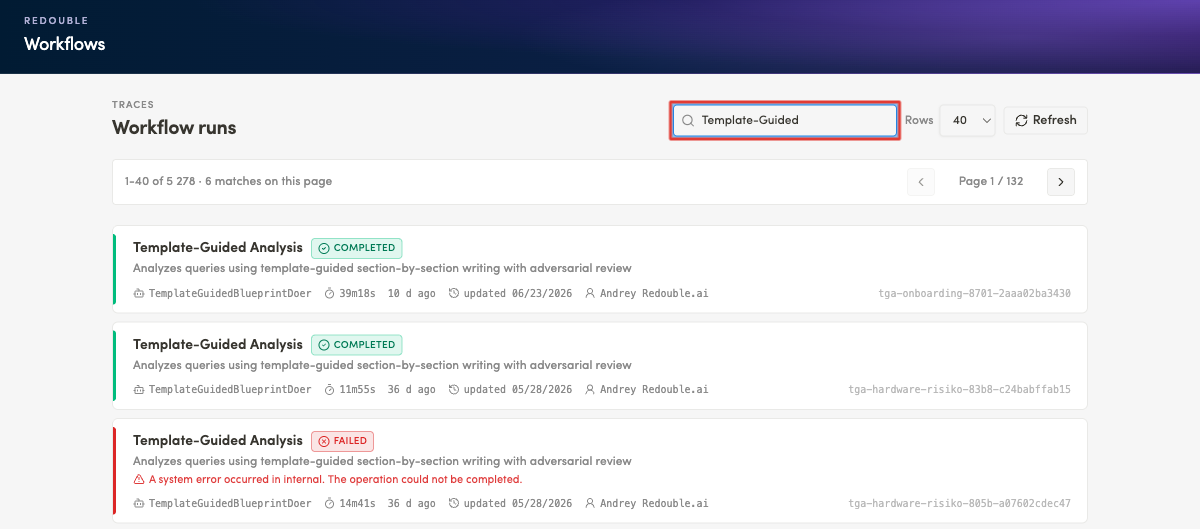
Filtering Runs
Steps:
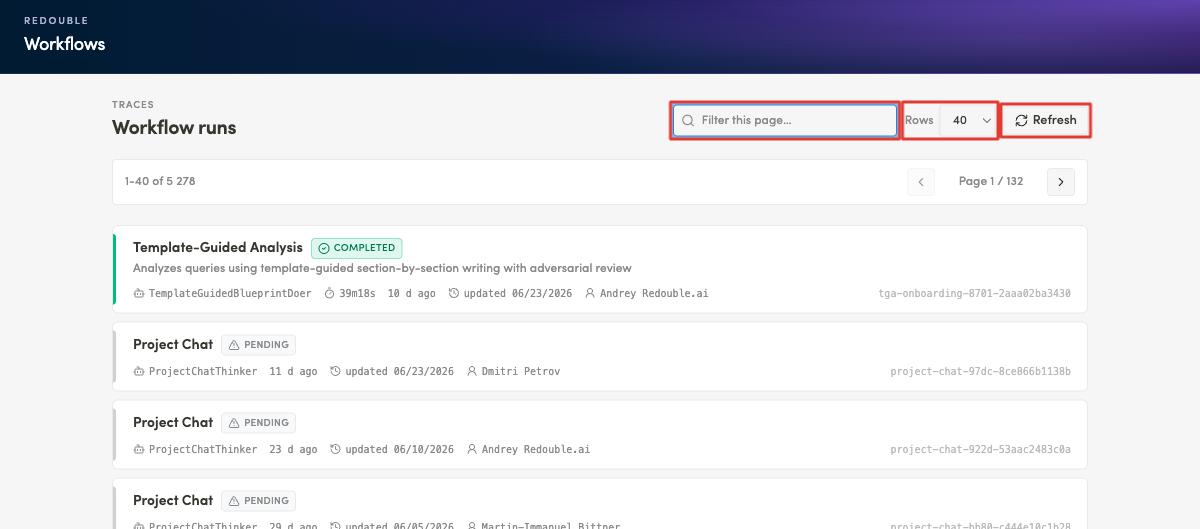
- Click the filter field at the top of the list ("Filter this page…").
- Type any of the following to narrow the list:
- Process name
- Executor
- Author
- ID fragment
- The list updates as you type, keeping only matching cards.
- To clear the filter, empty the field — and the full list will be shown again.
Pagination & Rows per Page
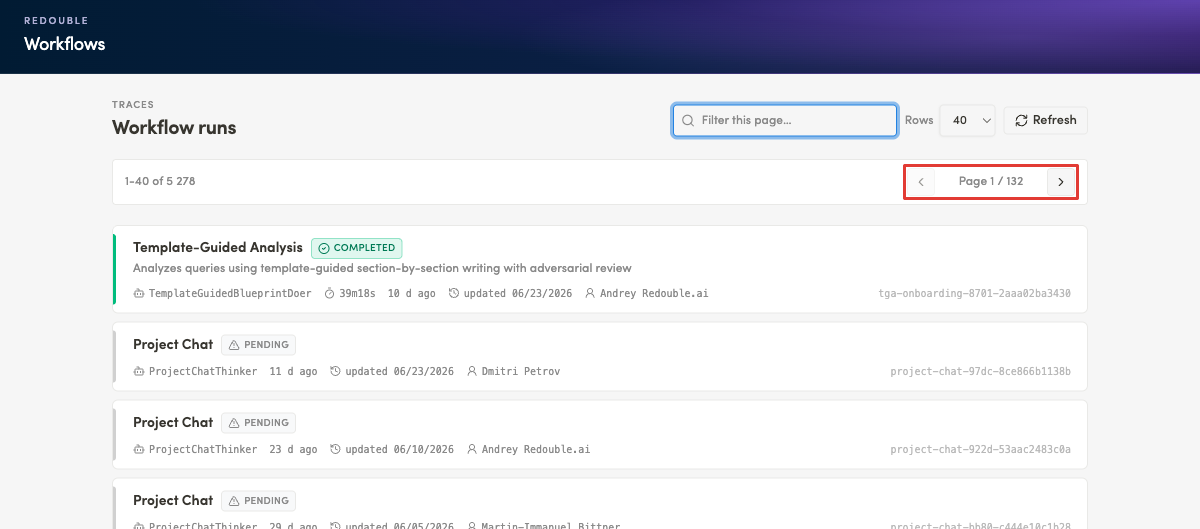
Paging through runs
- Use Next ("Next workflow page") to move to the following page — the counter updates
- Use Previous to go back one page.
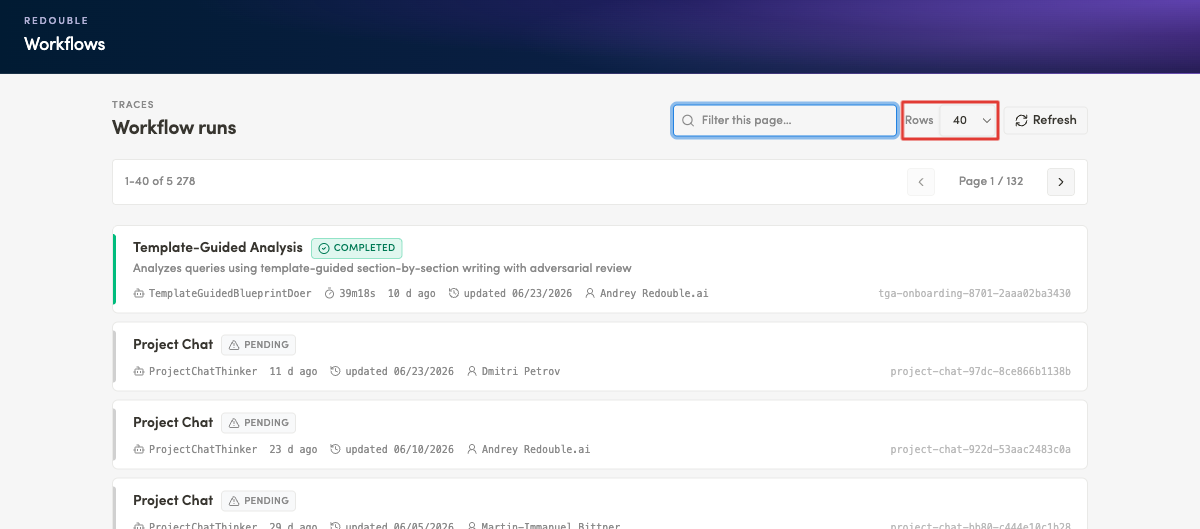
Rows per page
- Open the Rows per page selector
- Choose 20, 40, 80 or 120. The default value is 40.
Opening a Trace
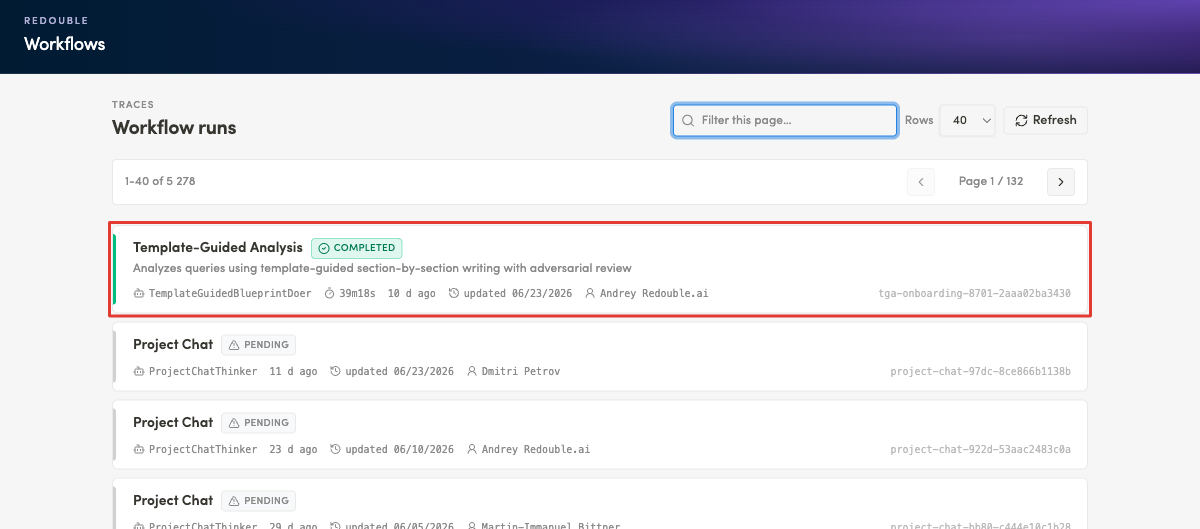
- Click any run card.
- See the selected trace being opened.
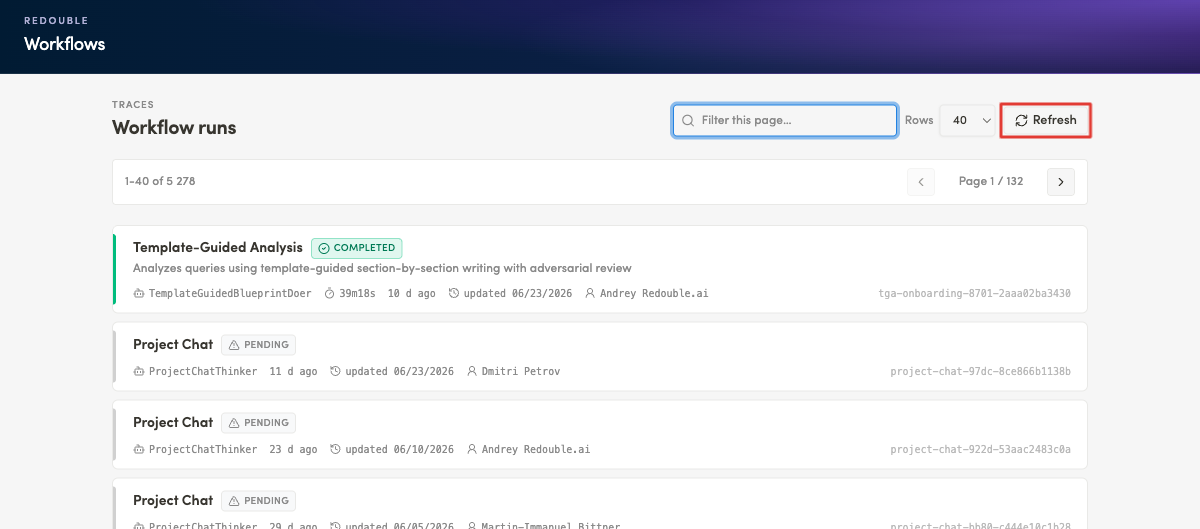
- User can also refresh the page by clicking *Refresh button
Result: User can successfully change the appearence of the list and move from the high-level list into the detailed breakdown of a single run.
Working with the Trace
Each trace screen consists of several elements.
Layout of the trace screen:
- Top bar
- View switcher: Graph / Waterfall / Tree
- Side panels group: Deps / Tool I/O / Details.
- Visualization area
- Right-hand panels
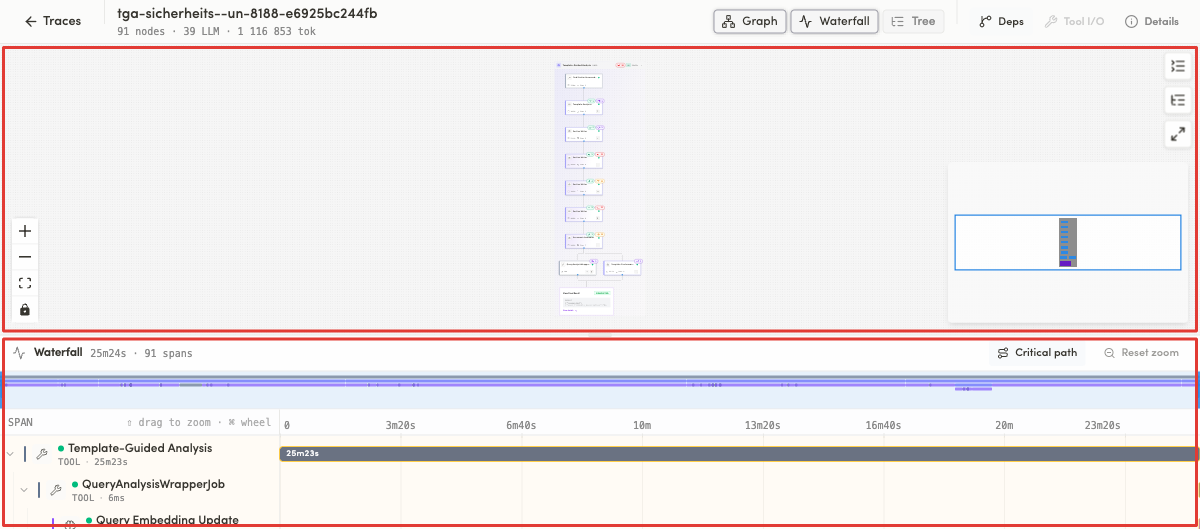
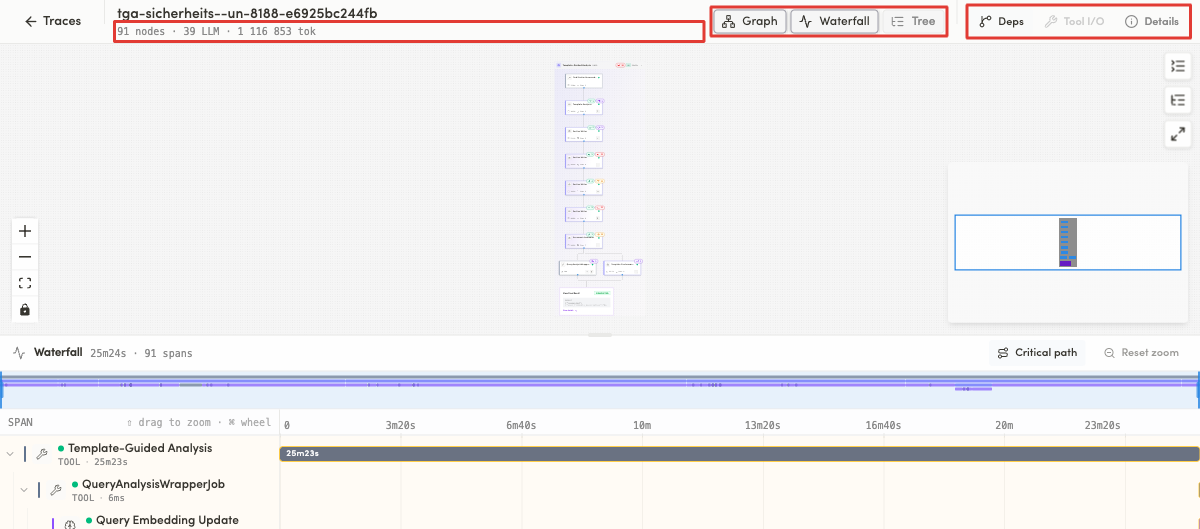
User can pick a view that fits his goal:
- Graph
- Waterfall
- Tree
Graph View
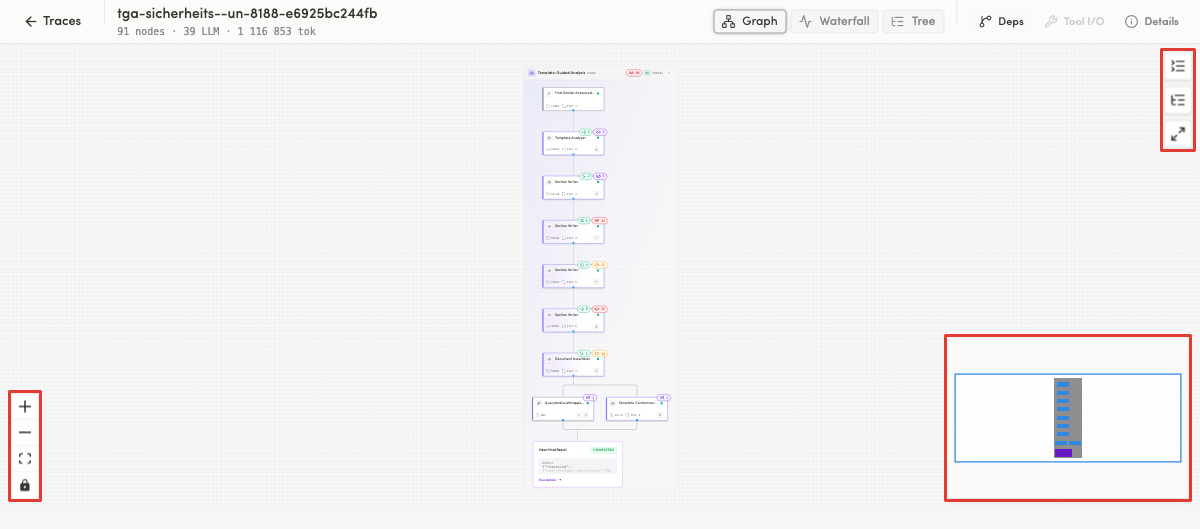
A node graph of the run, with arrows connecting steps. It includes collapsible groups, guardrail badges, nested-step counters, and a final-result card.
User can perform several actions:
- Zoom In / Out — click the
+/−buttons, or hold the mouse over the graph and scroll the wheel for smooth zoom. - Fit View — click Fit View to fit the whole graph into the visible area.
- Pan — click and drag empty canvas to move around.
- Mini Map — click a region of the mini map to jump there.
- Toggle Interactivity (lock icon) — lock/unlock the canvas to prevent or allow moving node positions.
Waterfall View
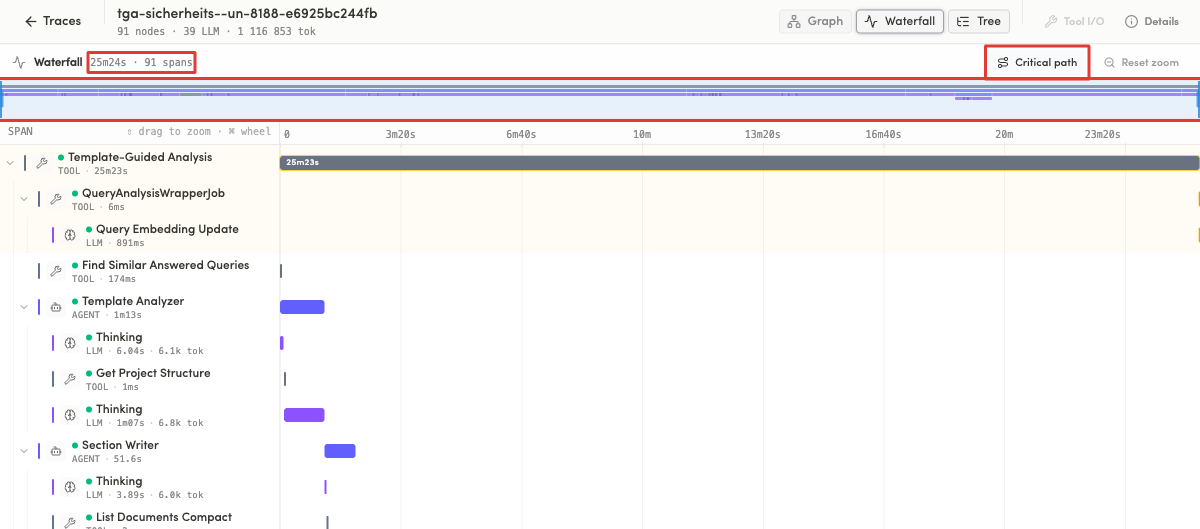
What it shows: A time diagram of spans. Each row is a span with its name, type, duration and sometimes tokens. Groups are collapsible. Controls include Critical path, Reset zoom, a zoom-window slider, and hints "⇧ drag to zoom · ⌘ wheel".
Tree View
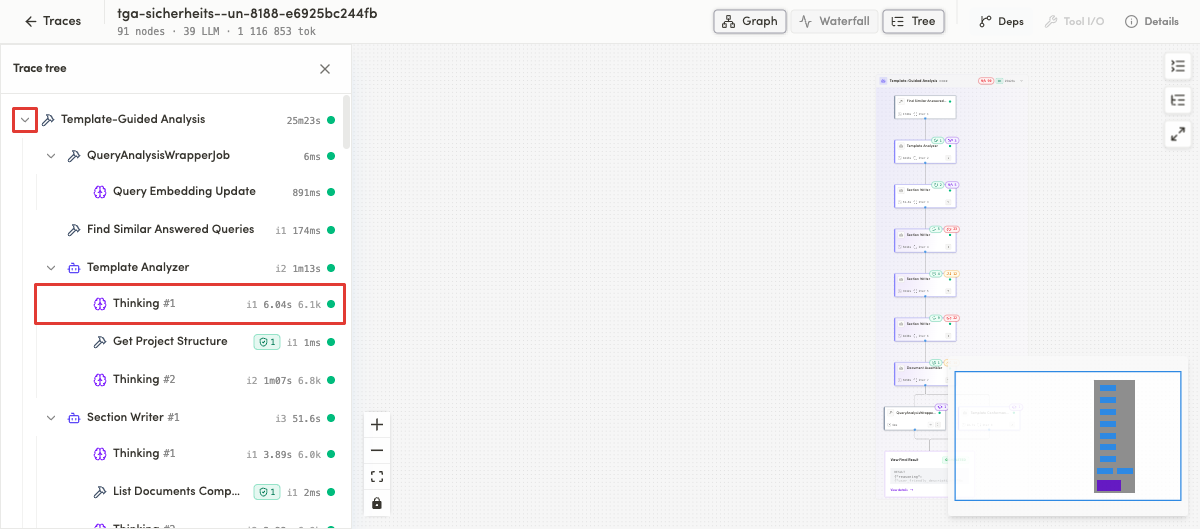
A hierarchical Trace tree. Each node has a type icon, a name, an iteration label a duration, tokens (for LLM nodes) and tool-call counters. Branches are expandable.
User can perform several actions
- Open the Tree view to see the hierarchy from the root down.
- Click a node's expand arrow to reveal its children; click again to collapse.
- Read repeated steps by their numbering — numbering is sequential.
- Read iteration labels — they follow the execution order.
- Read per-node metrics on LLM nodes — duration and tokens.
- Click any node to load its details into the Inspector; the selection syncs with Graph and Waterfall.
- Expand the deepest branch to verify structure — indentation stays correct, with no truncation.
Result: You have a complete, multi-angle picture of a single run and can drill into any step.
Side Panels
Inspector / Details
The Inspector (opened via the Details side panel) shows everything about the currently selected node. It has a Pretty / JSON toggle and displays the node's type and status (e.g. LLM_CALL · COMPLETED), name, an ownership line ("in {parent} · Iter N · {duration}"), a Final results block, and collapsible sections.
User can close it with the ×.
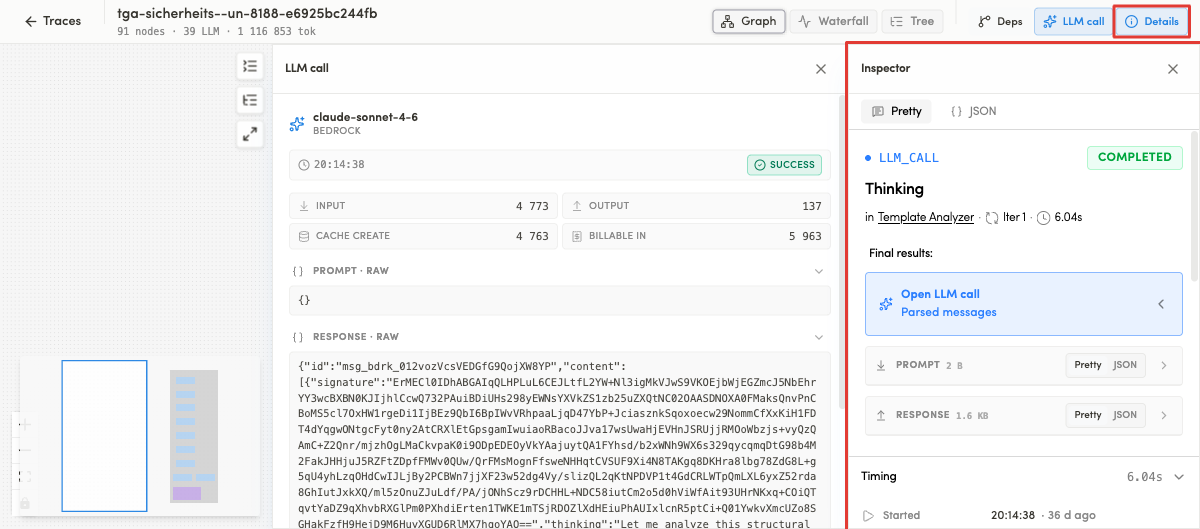
The panel is read top-to-bottom. There are several sections:
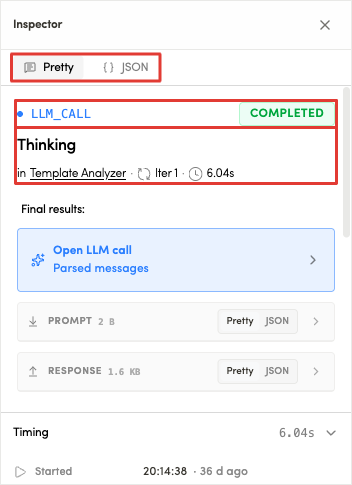
1. Format toggle + identity header
At the very top a Pretty / JSON toggle switches the whole panel between a human-readable layout (Pretty) and the raw payload (JSON). Under it is the node's identity:
- Type badge + status — e.g.
LLM_CALLwith a green COMPLETED pill (other statuses:RUNNING,PENDING,FAILED). - Name — the step's name (e.g. Thinking).
- Ownership line — The parent name is a link
2. Final results
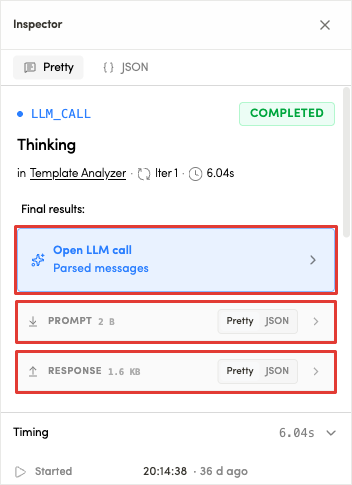
The Final results block is the node's output.
- LLM node — a quick Open LLM call → Parsed messages button that takes you to the full panel, plus short
- PROMPT and RESPONSE previews. Each preview shows its size and has its own Pretty / JSON toggle.
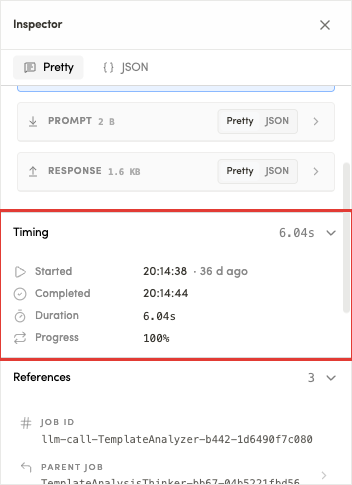
3. Timing
Timing shows exactly when the step was ran:
- Started — absolute clock time plus a relative age
- Completed — when it finished.
- Duration — how long it took.
- Progress — completion percentage (100% for a finished step).
4. References
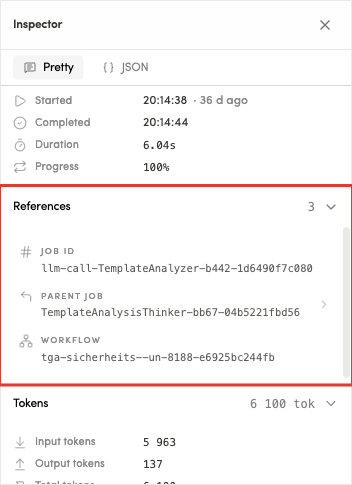
References displays the identifiers that tie this node into the run:
- JOB ID — this node's own id (the value used in
sel=). - PARENT JOB — the id of the step that owns it.
- WORKFLOW — the trace id it belongs to.
5. Tokens
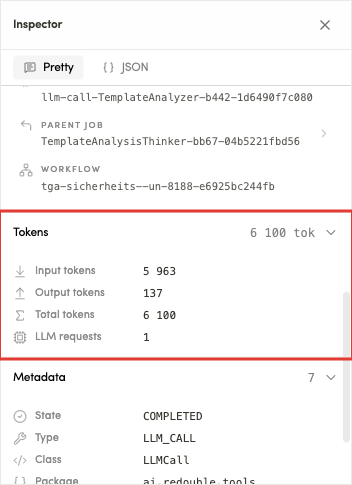
Tokens displays token breakdown that drives cost:
- Input tokens / Output tokens — the split between prompt and completion.
- Total tokens — their sum.
- LLM requests — how many model calls this node made.
6. Metadata
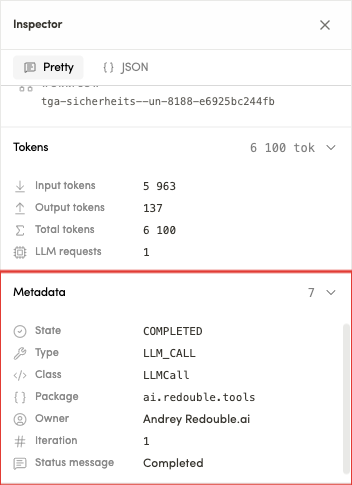
Metadata displays the low-level attributes of the step:
- State
- Type
- Class
- Package
- Owner
- Iteration
- Status message
Tool I/O
The Tool I/O panel shows the input and output of a tool call.
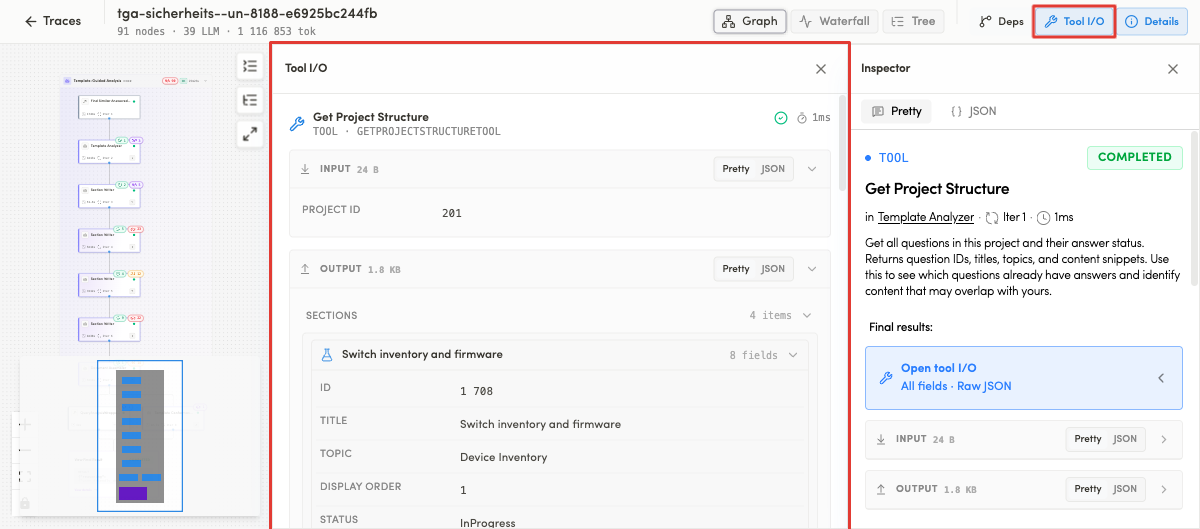
Header
The top of the panel names the tool and how the call went:
- the tool's display name
- its type and class
- a status icon and the call's duration on the right.
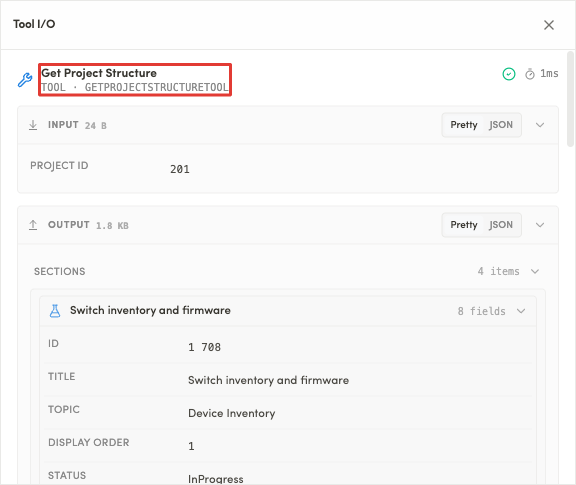
Input
The INPUT block shows the parameters the tool was called with. Its header carries the payload size and a Pretty / JSON toggle, then each parameter is listed as a name/value pair.
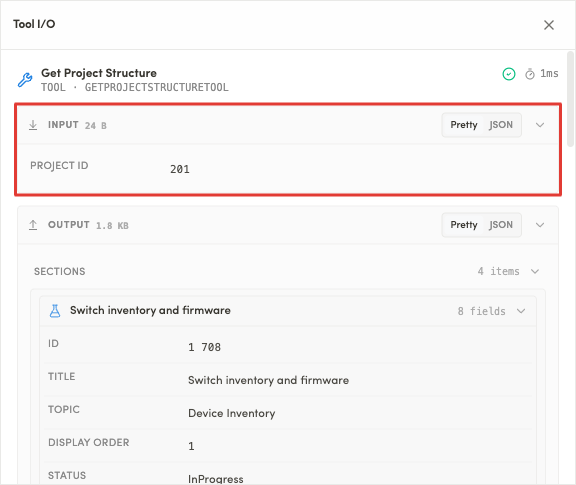
Output
The OUTPUT block shows the result. Its header also carries the size and a Pretty / JSON toggle. When the result is structured, Retrax lays it out as collapsible sections — so a big response stays readable instead of dumping a wall of JSON.
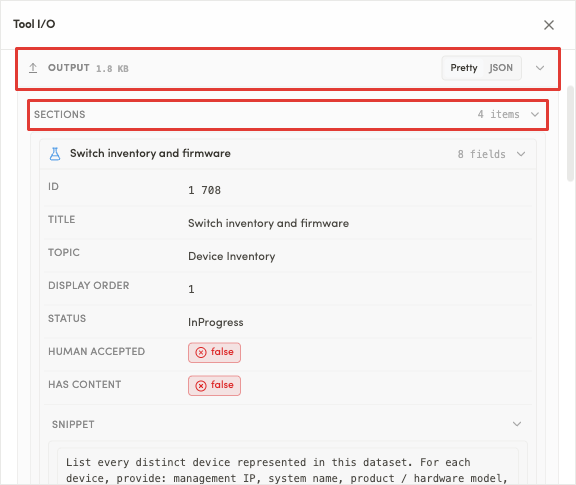
User can perform several types of actions:
- Select a tool node (e.g. "Get Project Structure"). The Tool I/O button becomes active.
- Open Tool I/O.
- Read the input — the parameters the tool was called with.
- Read the output — the result the tool returned.
- If a format toggle is available, switch between Pretty and JSON.
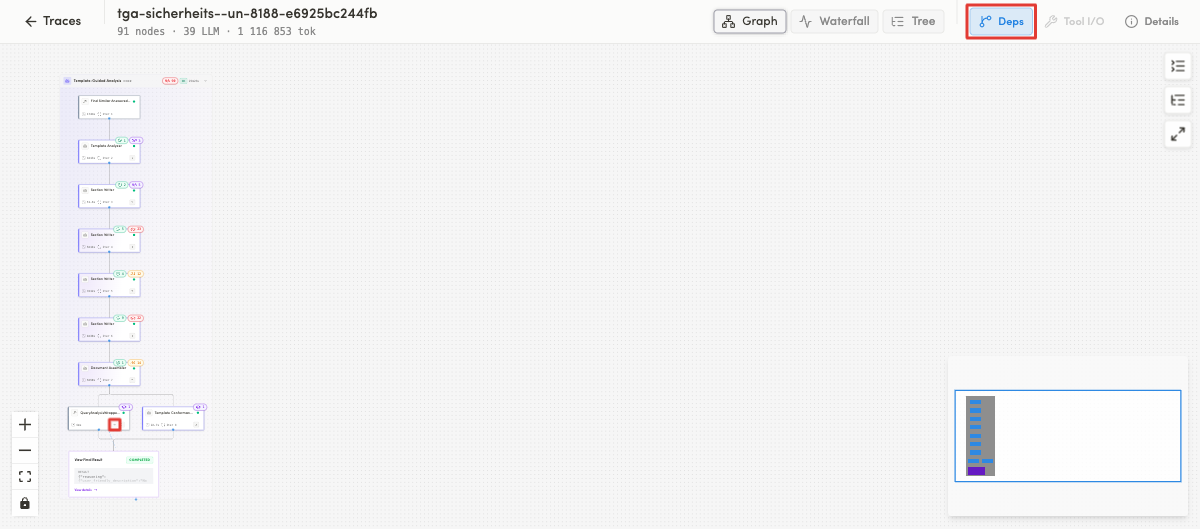
Dependencies (Deps)
The Dependencies panel reveals scheduling dependencies between nodes.
User can perform several types of actions:
- Click Deps to open the dependencies panel / mode.
- Find a node marked "Has scheduling dependencies" — the indicator confirms it has them.
- Select a node that has dependencies — its related nodes / edges are highlighted.
- Select an independent node — no dependencies are shown (empty), confirming it isn't waiting on anything.
LLM Call
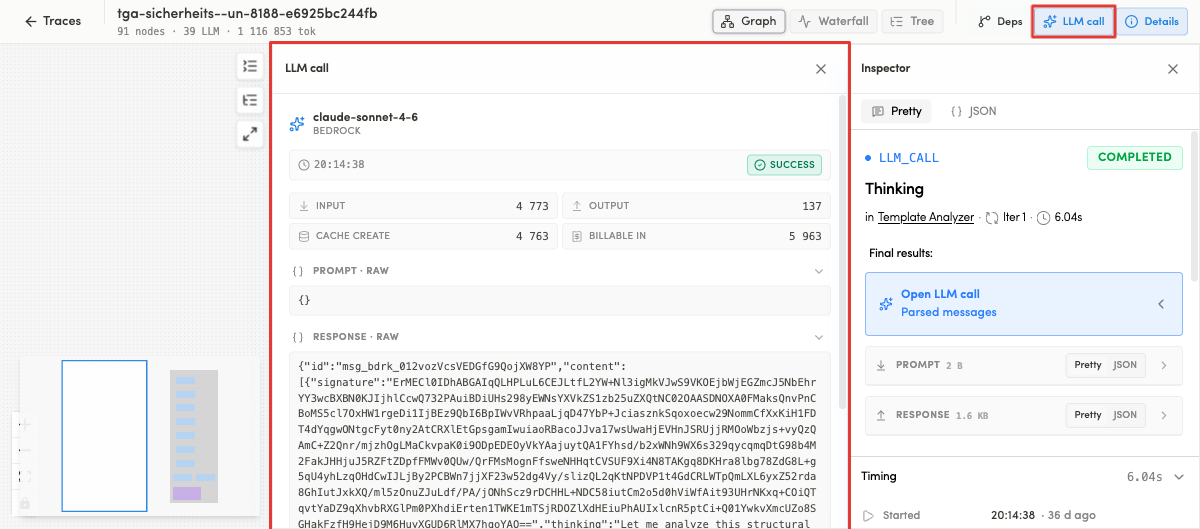
When user selects an LLM node, the middle side-panel button becomes LLM call.
Opening it shows the details of that model call:
- model and provider (e.g. claude-sonnet-4-6 · BEDROCK)
- a timestamp
- a status
- a token breakdown
- raw prompt/response.