
Side Panels
Inspector / Details
The Inspector (opened via the Details side panel) shows everything about the currently selected node. It has a Pretty / JSON toggle and displays the node's type and status (e.g. LLM_CALL · COMPLETED), name, an ownership line ("in {parent} · Iter N · {duration}"), a Final results block, and collapsible sections.
User can close it with the ×.
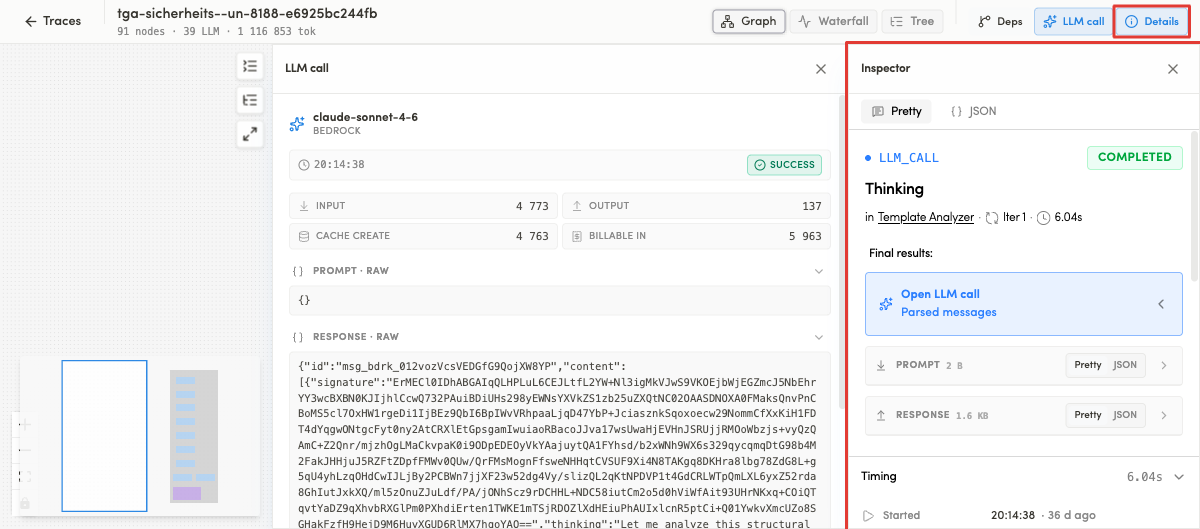
The panel is read top-to-bottom. There are several sections:
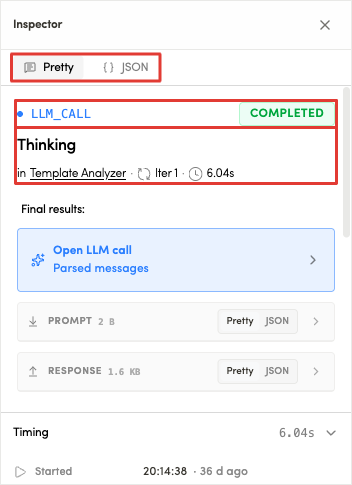
1. Format toggle + identity header
At the very top a Pretty / JSON toggle switches the whole panel between a human-readable layout (Pretty) and the raw payload (JSON). Under it is the node's identity:
- Type badge + status — e.g.
LLM_CALLwith a green COMPLETED pill (other statuses:RUNNING,PENDING,FAILED). - Name — the step's name (e.g. Thinking).
- Ownership line — The parent name is a link
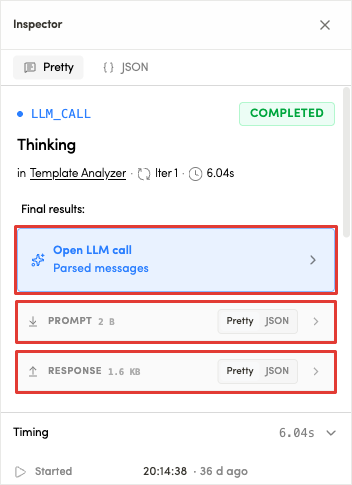
2. Final results
The Final results block is the node's output.
- LLM node — a quick Open LLM call → Parsed messages button that takes you to the full panel, plus short
- PROMPT and RESPONSE previews. Each preview shows its size and has its own Pretty / JSON toggle.
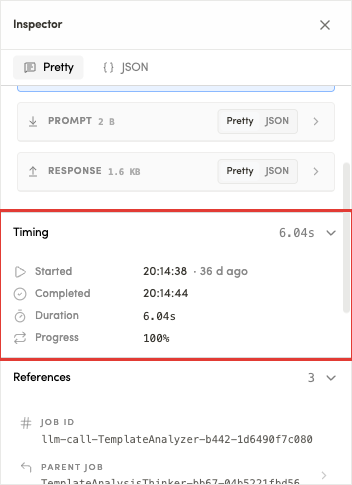
3. Timing
Timing shows exactly when the step was ran:
- Started — absolute clock time plus a relative age
- Completed — when it finished.
- Duration — how long it took.
- Progress — completion percentage (100% for a finished step).
4. References
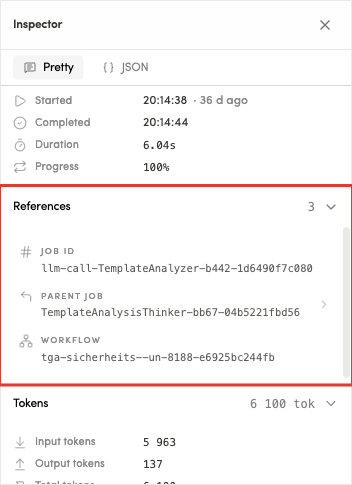
References displays the identifiers that tie this node into the run:
- JOB ID — this node's own id (the value used in
sel=). - PARENT JOB — the id of the step that owns it.
- WORKFLOW — the trace id it belongs to.
5. Tokens
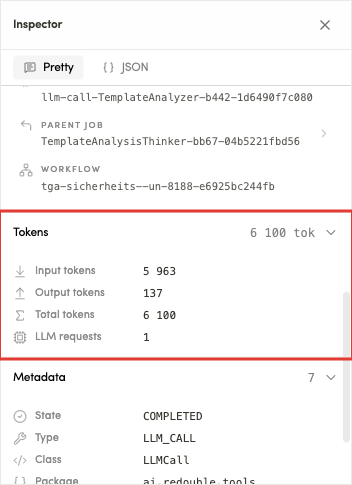
Tokens displays token breakdown that drives cost:
- Input tokens / Output tokens — the split between prompt and completion.
- Total tokens — their sum.
- LLM requests — how many model calls this node made.
6. Metadata
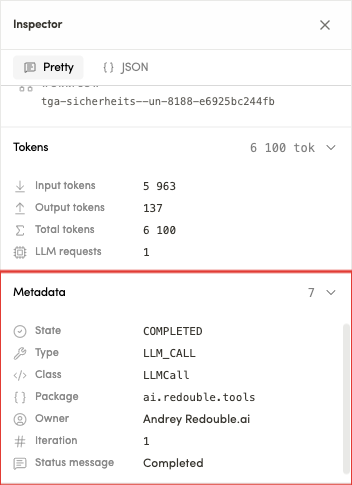
Metadata displays the low-level attributes of the step:
- State
- Type
- Class
- Package
- Owner
- Iteration
- Status message
Tool I/O
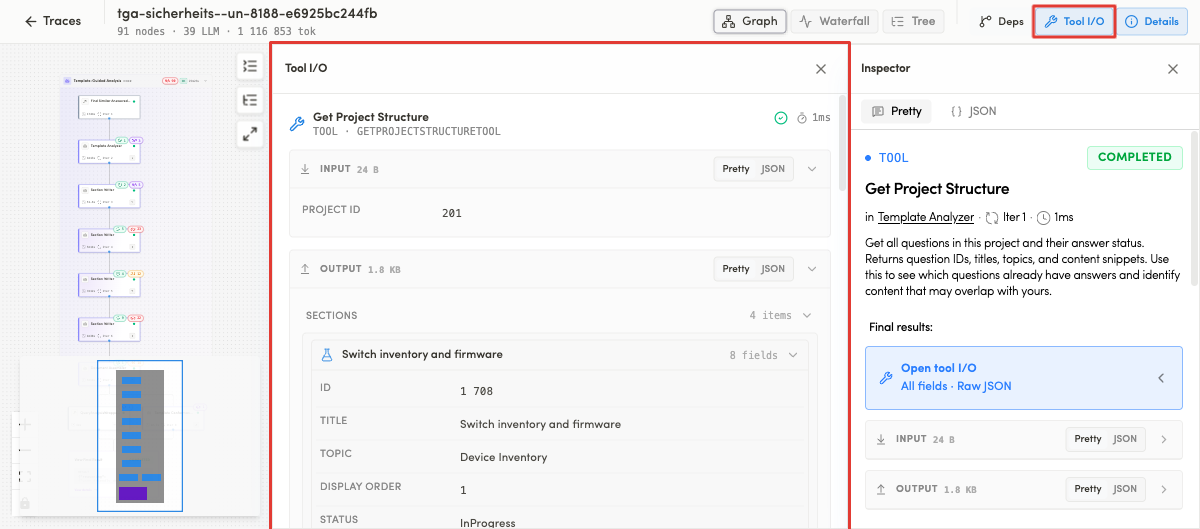
The Tool I/O panel shows the input and output of a tool call.
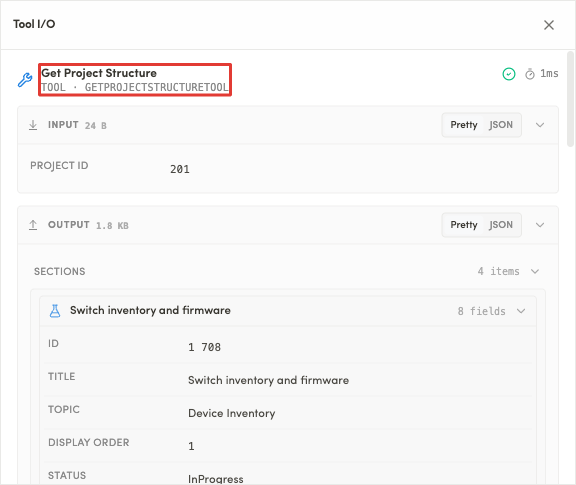
Header
The top of the panel names the tool and how the call went:
- the tool's display name
- its type and class
- a status icon and the call's duration on the right.
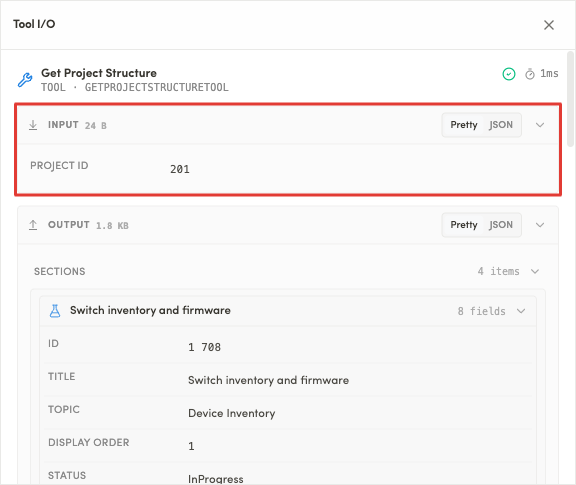
Input
The INPUT block shows the parameters the tool was called with. Its header carries the payload size and a Pretty / JSON toggle, then each parameter is listed as a name/value pair.
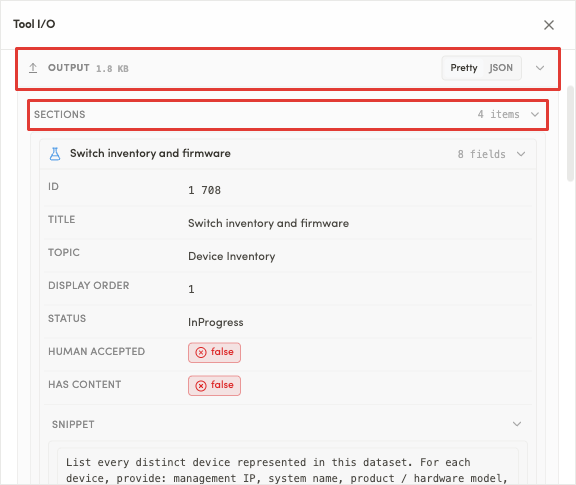
Output
The OUTPUT block shows the result. Its header also carries the size and a Pretty / JSON toggle. When the result is structured, Retrax lays it out as collapsible sections — so a big response stays readable instead of dumping a wall of JSON.
User can perform several types of actions:
- Select a tool node (e.g. "Get Project Structure"). The Tool I/O button becomes active.
- Open Tool I/O.
- Read the input — the parameters the tool was called with.
- Read the output — the result the tool returned.
- If a format toggle is available, switch between Pretty and JSON.
Dependencies (Deps)
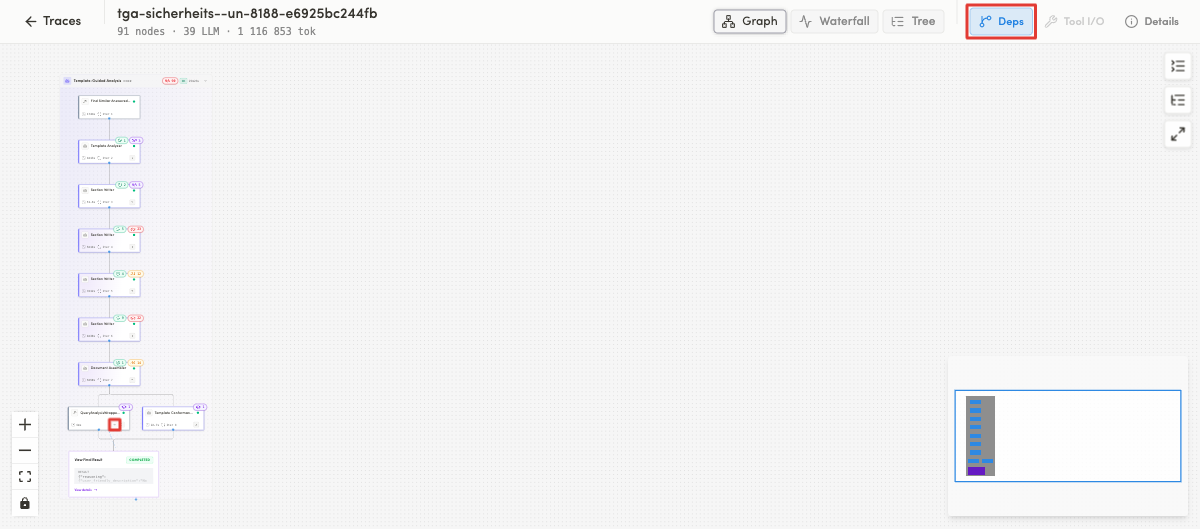
The Dependencies panel reveals scheduling dependencies between nodes.
User can perform several types of actions:
- Click Deps to open the dependencies panel / mode.
- Find a node marked "Has scheduling dependencies" — the indicator confirms it has them.
- Select a node that has dependencies — its related nodes / edges are highlighted.
- Select an independent node — no dependencies are shown (empty), confirming it isn't waiting on anything.
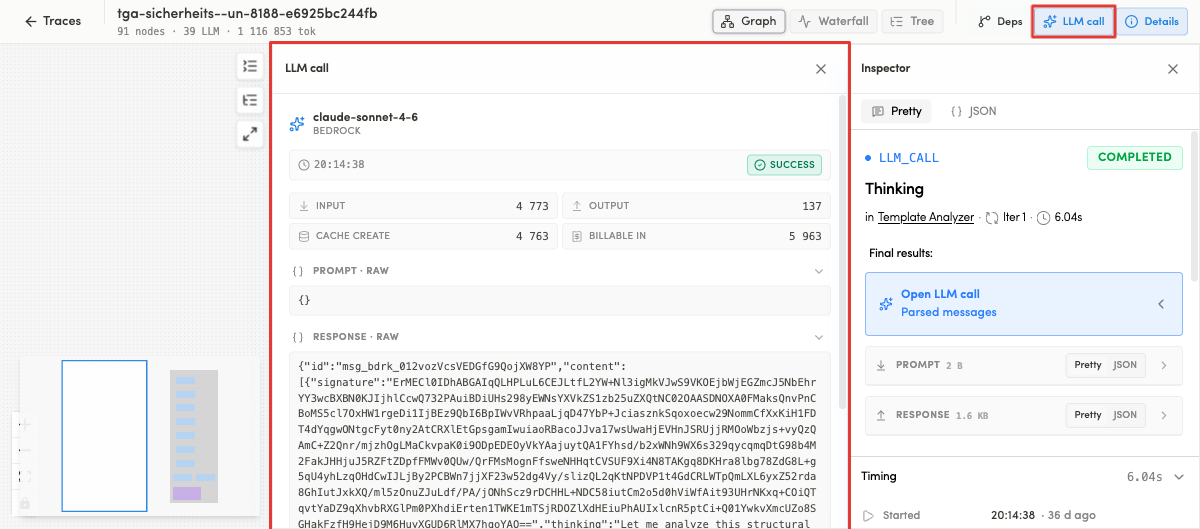
LLM Call
When user selects an LLM node, the middle side-panel button becomes LLM call.
Opening it shows the details of that model call:
- model and provider (e.g. claude-sonnet-4-6 · BEDROCK)
- a timestamp
- a status
- a token breakdown
- raw prompt/response.
No comments to display
No comments to display