
Working with the Trace
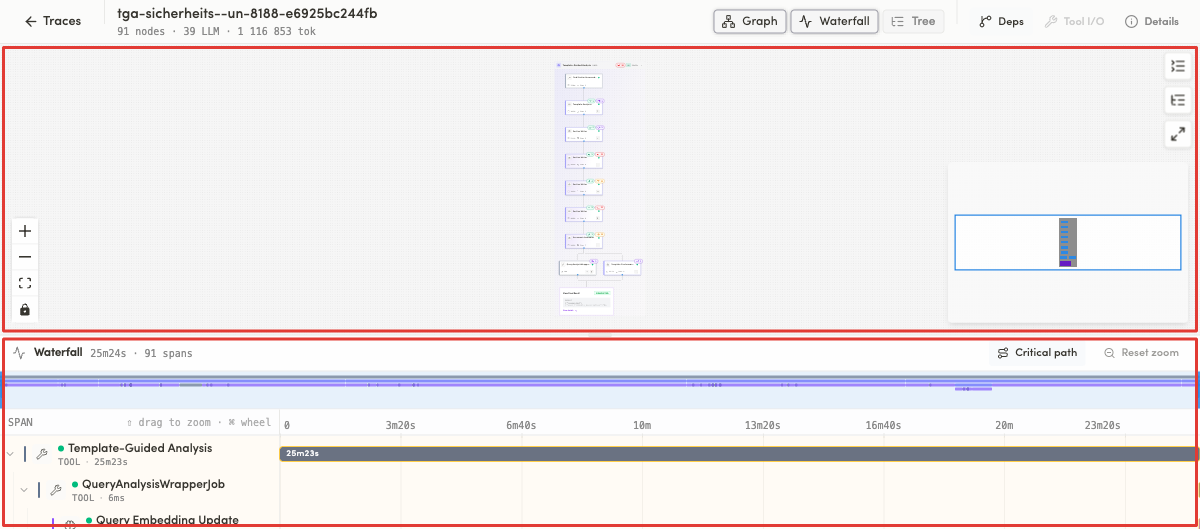
Each trace screen consists of several elements.
Layout of the trace screen:
- Top bar
- View switcher: Graph / Waterfall / Tree
- Side panels group: Deps / Tool I/O / Details.
- Visualization area
- Right-hand panels
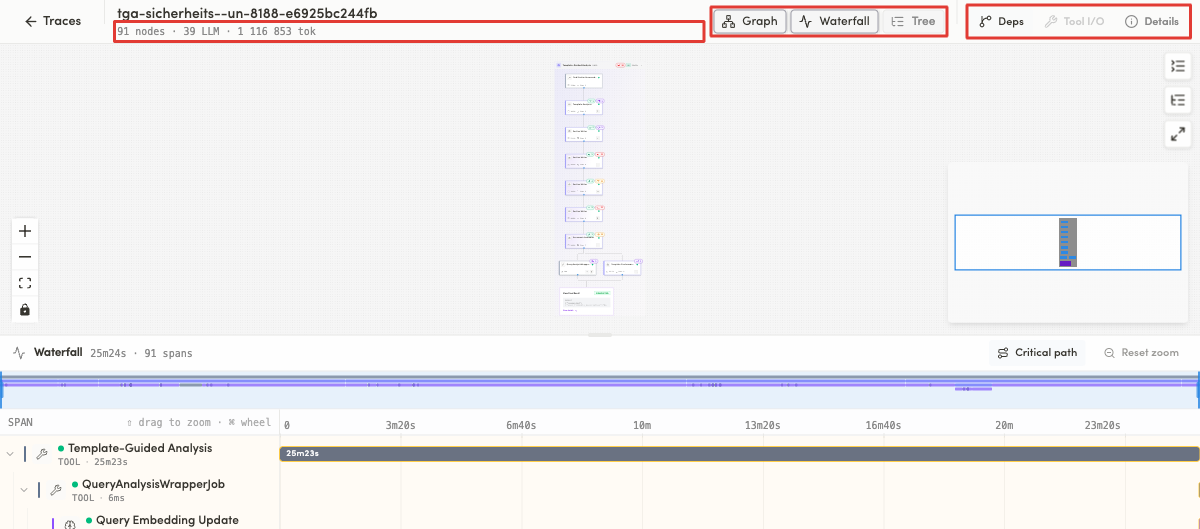
User can pick a view that fits his goal:
- Graph
- Waterfall
- Tree
Graph View
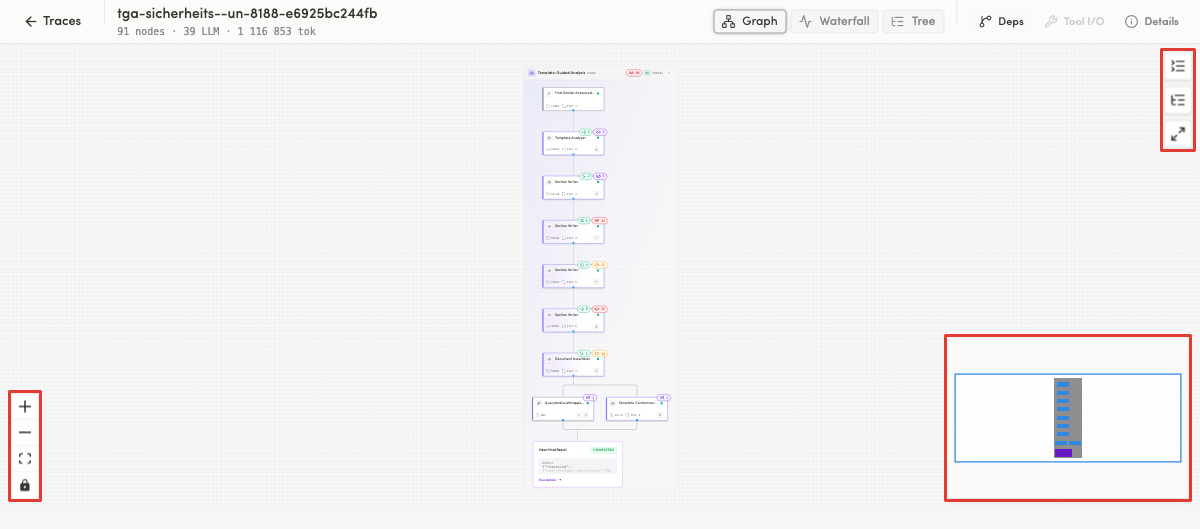
A node graph of the run, with arrows connecting steps. It includes collapsible groups, guardrail badges, nested-step counters, and a final-result card.
User can perform several actions:
- Zoom In / Out — click the
+/−buttons, or hold the mouse over the graph and scroll the wheel for smooth zoom. - Fit View — click Fit View to fit the whole graph into the visible area.
- Pan — click and drag empty canvas to move around.
- Mini Map — click a region of the mini map to jump there.
- Toggle Interactivity (lock icon) — lock/unlock the canvas to prevent or allow moving node positions.
Waterfall View
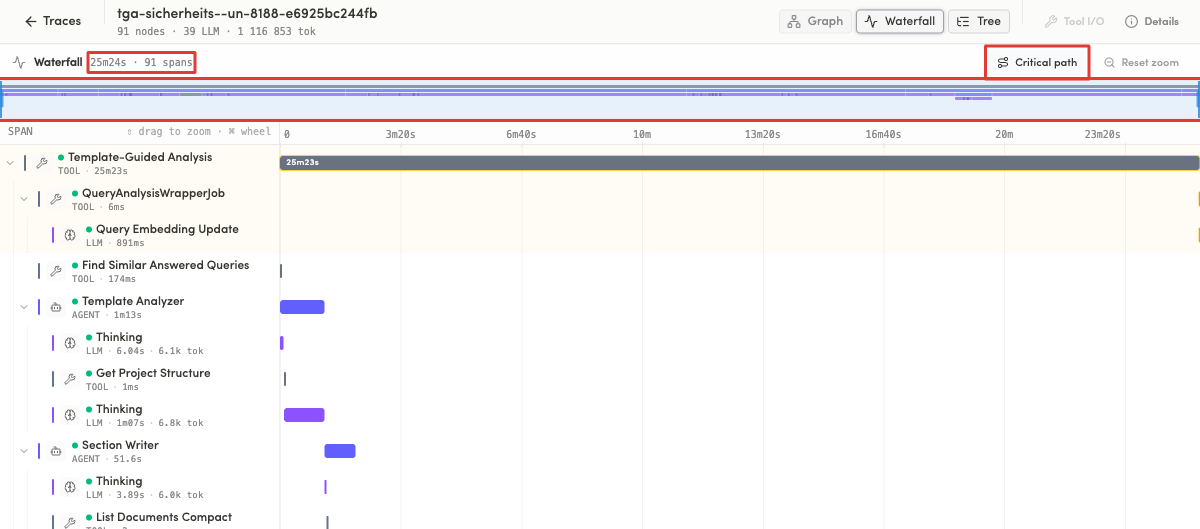
What it shows: A time diagram of spans. Each row is a span with its name, type, duration and sometimes tokens. Groups are collapsible. Controls include Critical path, Reset zoom, a zoom-window slider, and hints "⇧ drag to zoom · ⌘ wheel".
Tree View
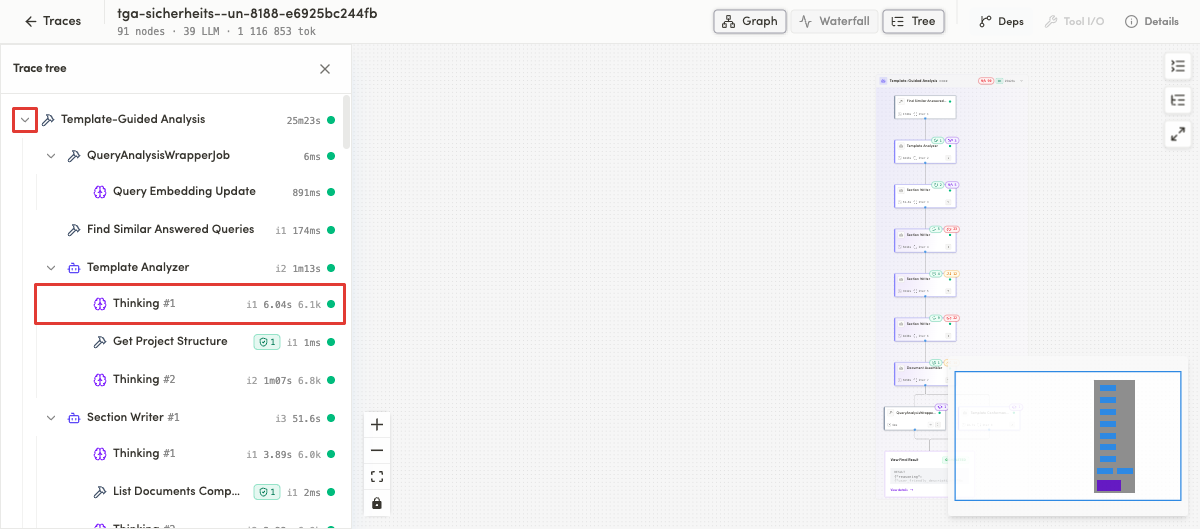
A hierarchical Trace tree. Each node has a type icon, a name, an iteration label a duration, tokens (for LLM nodes) and tool-call counters. Branches are expandable.
User can perform several actions
- Open the Tree view to see the hierarchy from the root down.
- Click a node's expand arrow to reveal its children; click again to collapse.
- Read repeated steps by their numbering — numbering is sequential.
- Read iteration labels — they follow the execution order.
- Read per-node metrics on LLM nodes — duration and tokens.
- Click any node to load its details into the Inspector; the selection syncs with Graph and Waterfall.
- Expand the deepest branch to verify structure — indentation stays correct, with no truncation.
Result: You have a complete, multi-angle picture of a single run and can drill into any step.
No comments to display
No comments to display